Composition and comparative analysis workflow
Songqi Duan
duan@songqi.org Source:vignettes/composition-analysis.Rmd
composition-analysis.RmdThis workflow covers the analysis tasks that happen after clusters or cell types already exist and the main question becomes comparative rather than structural:
- how cell states are distributed across samples
- whether cluster proportions shift between groups
- how QC or score columns differ across categories
library(Shennong)
library(dplyr)
library(knitr)
library(Seurat)

if (!exists("pbmc_small", inherits = FALSE)) {
  try(data("pbmc_small", package = "Shennong", envir = environment()), silent = TRUE)
}
if (!exists("pbmc_small", inherits = FALSE) && file.exists(file.path("data", "pbmc_small.rda"))) {
  load(file.path("data", "pbmc_small.rda"))
}
1. Summarize cell-state proportions
sn_calculate_composition() is the main helper for
grouped proportion summaries. The most common pattern is
sample-by-cluster composition.
knitr::kable(composition_tbl, digits = 2)| sample | seurat_clusters | proportion |
|---|---|---|
| pbmc1k | 0 | 16.25 |
| pbmc1k | 1 | 23.75 |
| pbmc1k | 2 | 43.75 |
| pbmc1k | 3 | 16.25 |
| pbmc3k | 0 | 65.00 |
| pbmc3k | 1 | 21.67 |
| pbmc3k | 3 | 13.33 |
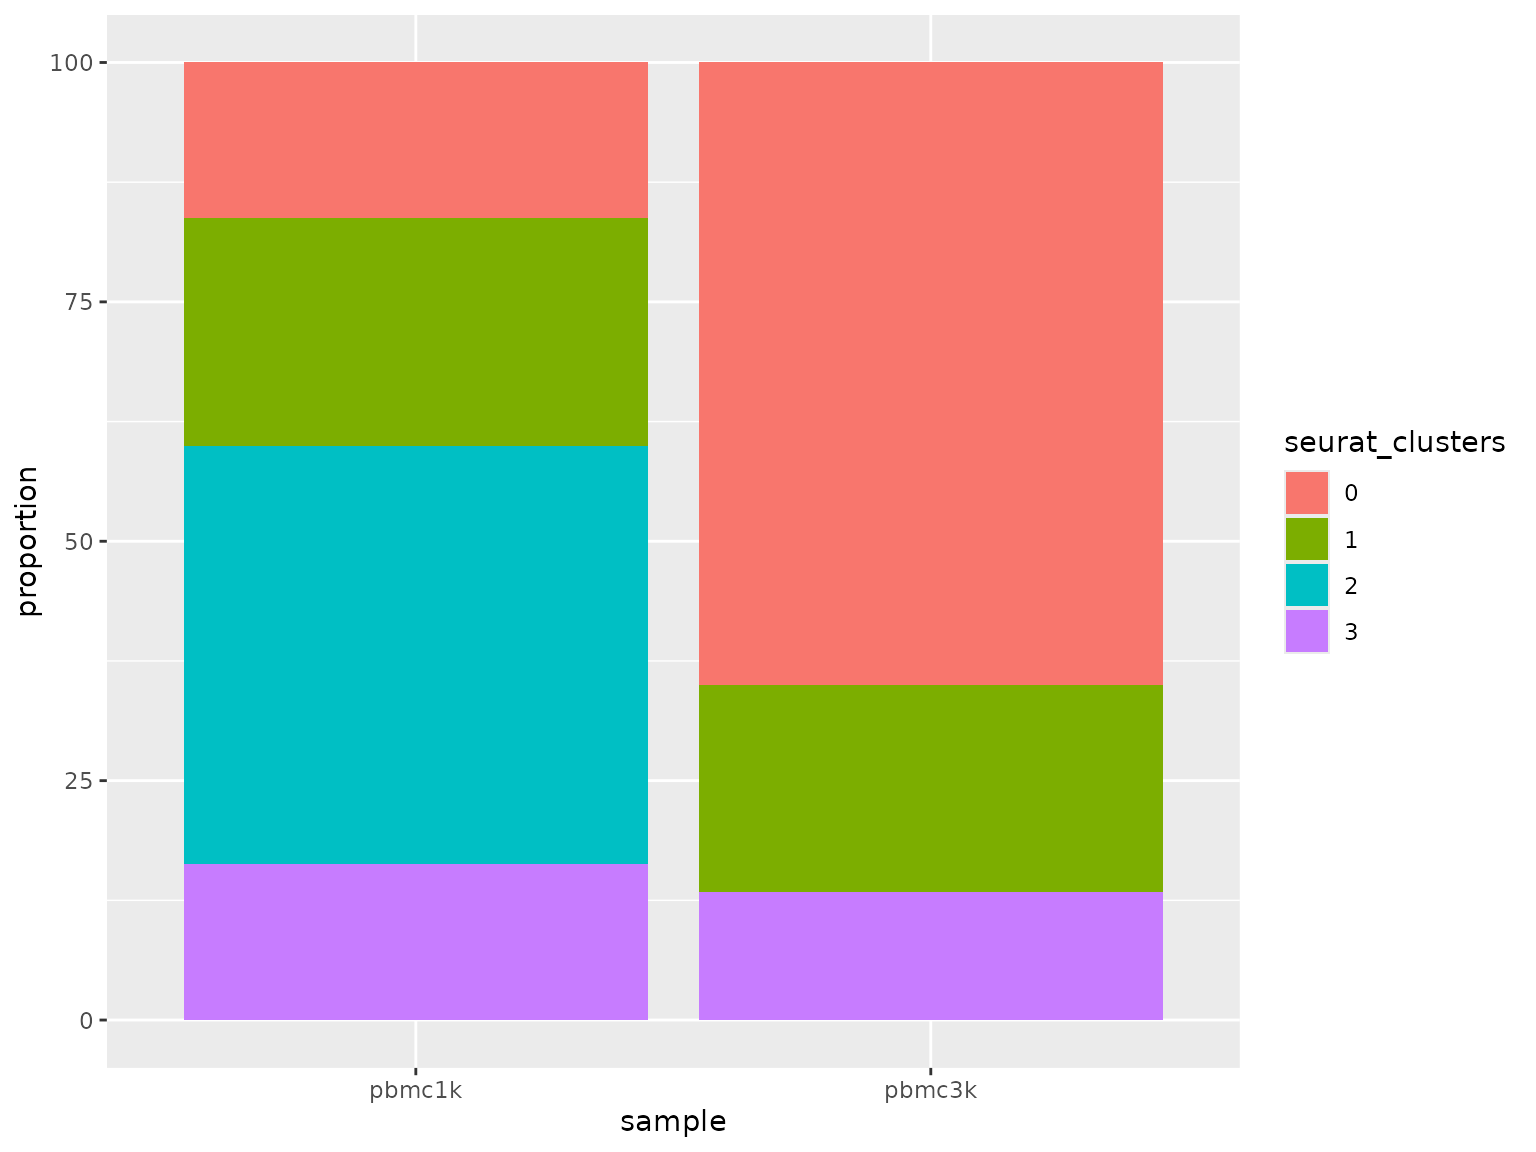
2. Plot proportions across groups
The returned composition table can be fed directly into
sn_plot_barplot().
sn_plot_barplot(
  composition_tbl,
  x = sample,
  y = proportion,
  fill = seurat_clusters
)
3. Compare categorical structure beyond clusters
The same composition helper also works for cell-cycle phase, annotation labels, or any other metadata column.
knitr::kable(phase_tbl, digits = 2)| sample | Phase | proportion |
|---|---|---|
| pbmc1k | G1 | 58.75 |
| pbmc1k | G2M | 21.25 |
| pbmc1k | S | 20.00 |
| pbmc3k | G1 | 49.17 |
| pbmc3k | G2M | 26.67 |
| pbmc3k | S | 24.17 |
4. Compare continuous scores across groups
Once a grouped table exists, Shennong’s plotting helpers can summarize how QC or score columns differ by sample or cluster.
sn_plot_boxplot(score_tbl, x = sample, y = nFeature_RNA)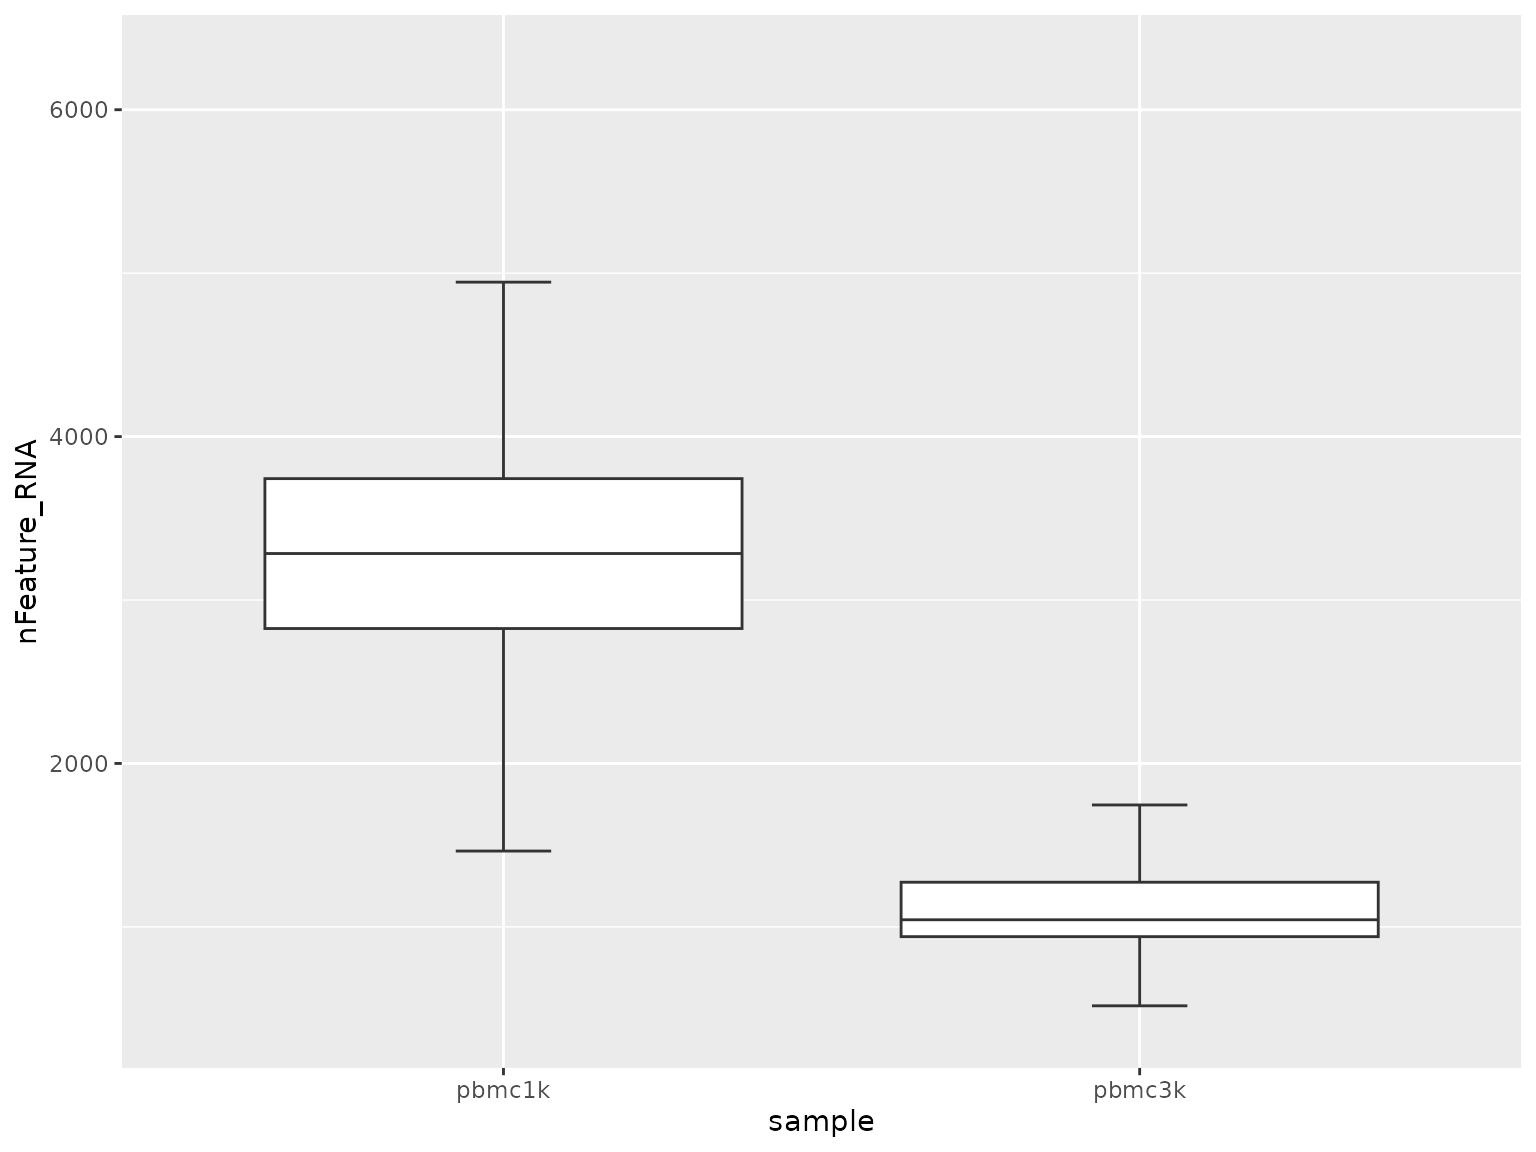
sn_plot_boxplot(score_tbl, x = seurat_clusters, y = S.Score)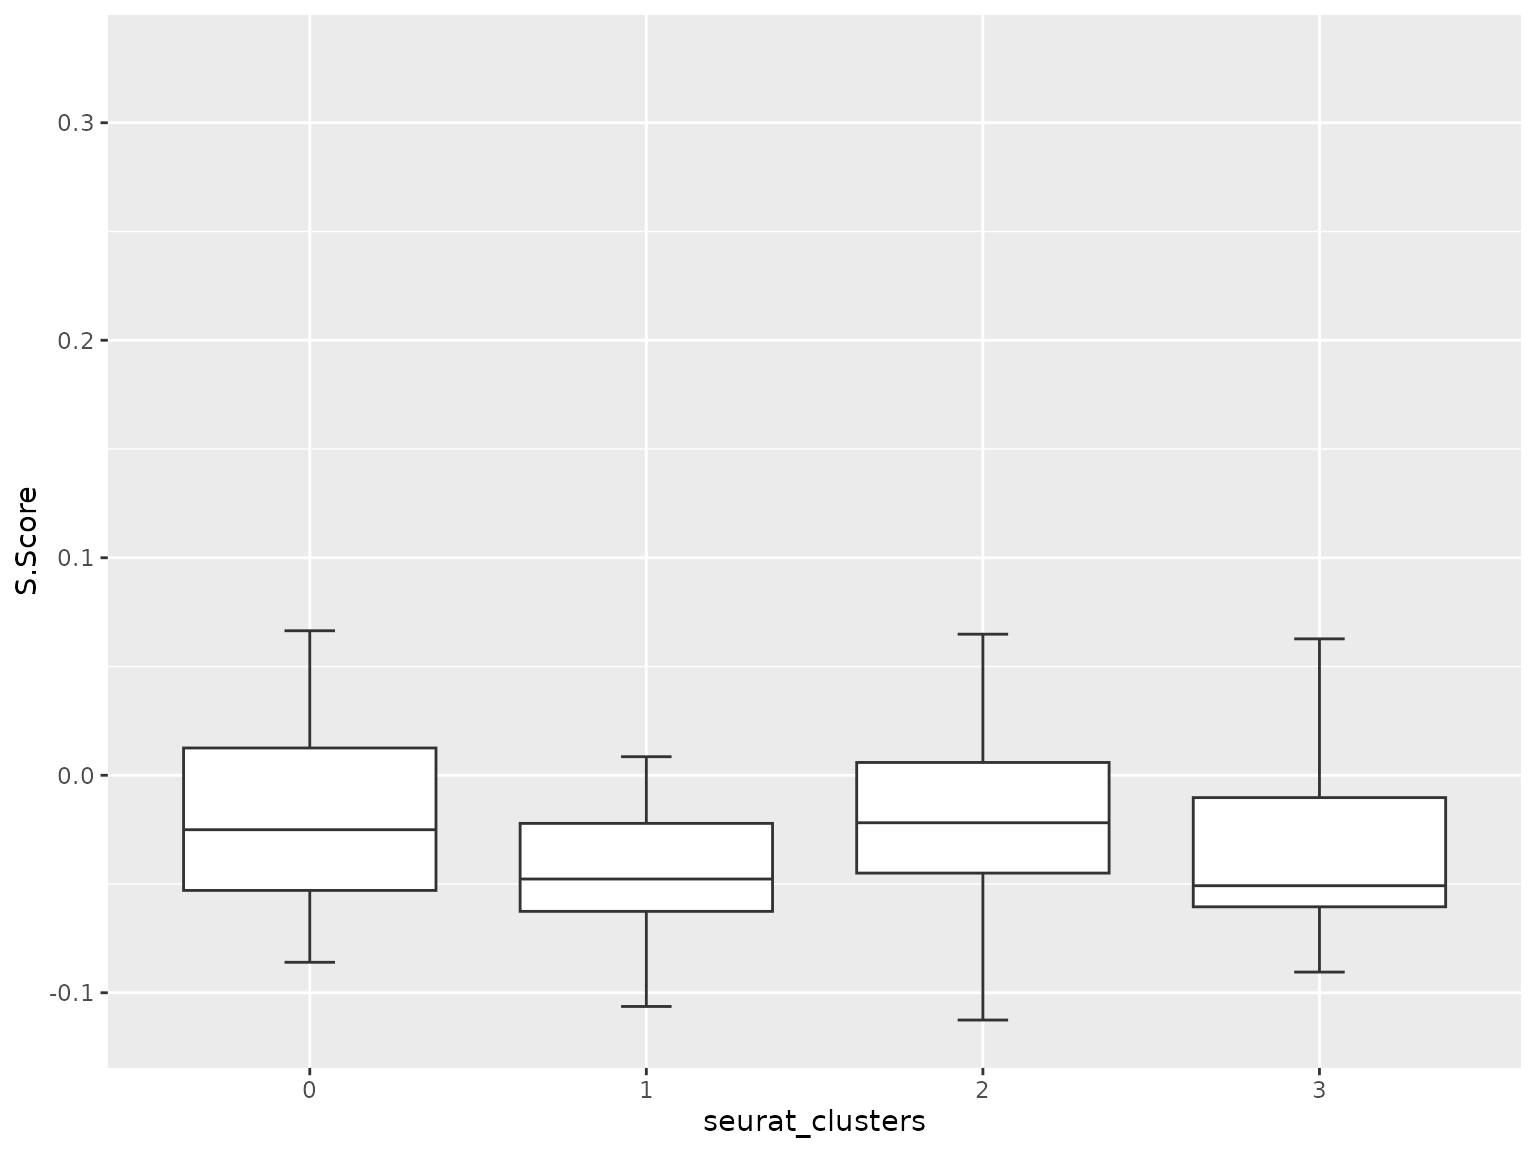
5. Keep comparative analysis downstream of stable labels
Composition and grouped-score analysis become much more interpretable once the labels are stable. In practice the recommended order is:
- preprocessing and QC
- clustering or integration
- marker or reference-based annotation
- composition and grouped comparisons
That order reduces the chance of over-interpreting composition shifts that are actually caused by unstable clustering.