Create a bar plot from a data frame
Examples
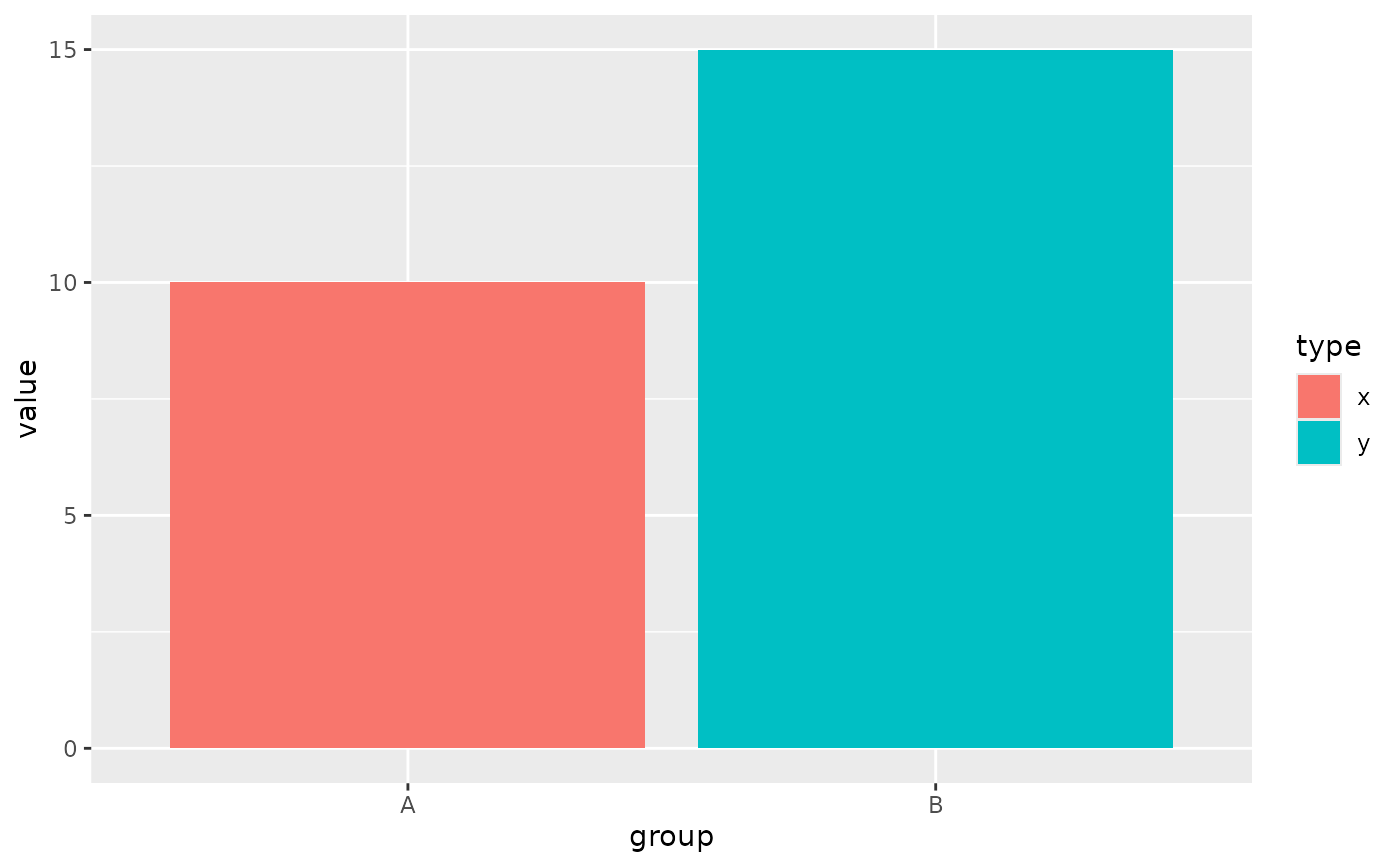
plot_data <- data.frame(group = c("A", "B"), value = c(10, 15), type = c("x", "y"))
sn_plot_barplot(plot_data, x = group, y = value, fill = type)
Create a bar plot from a data frame
plot_data <- data.frame(group = c("A", "B"), value = c(10, 15), type = c("x", "y"))
sn_plot_barplot(plot_data, x = group, y = value, fill = type)